
Datasets are valuable for both the development and testing of software and algorithms[1]. We are making a series of datasets available to be used freely. There are simulated land-vehicle (8), experimental small Unmanned Aerial Vehicle (UAV) (7), and automotive reference datasets (2). Below is a brief overview of the parameters available in each dataset.
| Parameter | Land Vehicle | Small UAV | Automotive |
|---|---|---|---|
| Type | Simulated | Measured | Measured |
| Reference Position | x | x | x |
| Reference Velocity | x | x | x |
| Reference Orientation | x | x | x |
| IMU (Accel, Gyro) | x | x | x |
| Magnetometer | x | x | x |
| GNSS Position | x | x | x |
| GNSS Velocity | x | x | x |
| Control Inputs | x | ||
| Equipment | na | Goldy AutoPilot | HGuide n380 |
| Sampling Rate | 10 Hz | 50 Hz | 100 Hz |
Accessing Datasets
The datasets are accessible through a Python package named onavdata. Instructions for installing onavdata and accessing the datasets are given next.
Installation
Installation is available using the command line pip utility.
~$ pip install --upgrade onavdata
Quick Start
>>> import onavdata
>>> onavdata.print_shortnames()
	 2011 UMN-UAV GPSFASER1
	 SIM-PERFECT-CAR NORTH VARY-SPEED FIXED-HEADING
	 2021-04-27 HGuide n380 Car Drive Between Traffic Lights
Further information about each dataset can be obtained using the description keyword. For example:
>>> onavdata.print_shortnames(description=True)
    2011 UMN-UAV GPSFASER1
2014-09-09 UofMN Conservancy 7 UAV Flights
Testing student controllers using standard roll/pitch doublets.

    SIM-PERFECT-CAR NORTH VARY-SPEED FIXED-HEADING
GNSS Applications & Methods - Chap. 7 - Case Study 2 - TRAJECTORY D
(no errors added) Automobile traveling north on perfectly level surface.
Flat and non-rotating Earth assumptions are simulated. No measurement
errors are simulated (i.e. sensor measurements are perfect).
Vehicle is traveling with a sinusoidally-varying speed and a fixed heading.

    2021-04-27 HGuide n380 Car Drive Between Traffic Lights
Honeywell HGuide n380 mounted onto car and driven from red-light to red-light southbound on highway 169 near city of Champlin, Minnesota.  Captures both acceleration and deceleration of car.
Sensor axes from driver perspective:
    +X: forward
    +Y: right
    +Z: down
    RF1 Antenna: above rear-right passenger (on roof rack)
    RF2 Antenna: above front-right passenger (on roof rack)
Load Data
By default, the data is returned as a Pandas DataFrame.
>>> import onavdata
>>> df = onavdata.get_data('2012 UMN-UAV GPSFASER1')
>>> df.head()
	                   AccelX (m/s^2)           ...             InputAileronRight (0-1)
	TimeFromStart (s)                           ...
	0.00                     1.176502           ...                              0.5516
	0.02                     1.078460           ...                              0.5516
	0.04                     1.143822           ...                              0.5516
	0.06                     1.176502           ...                              0.5516
	0.08                     1.209183           ...                              0.5516
Note that if desired, it is easy to access the same data as Numpy array via the Pandas DataFrame.
>>> time_sec_array = df.index.values.copy()
>>> data_array = df.values.copy()
>>> columns_hdr = df.columns.tolist()
Work with Data
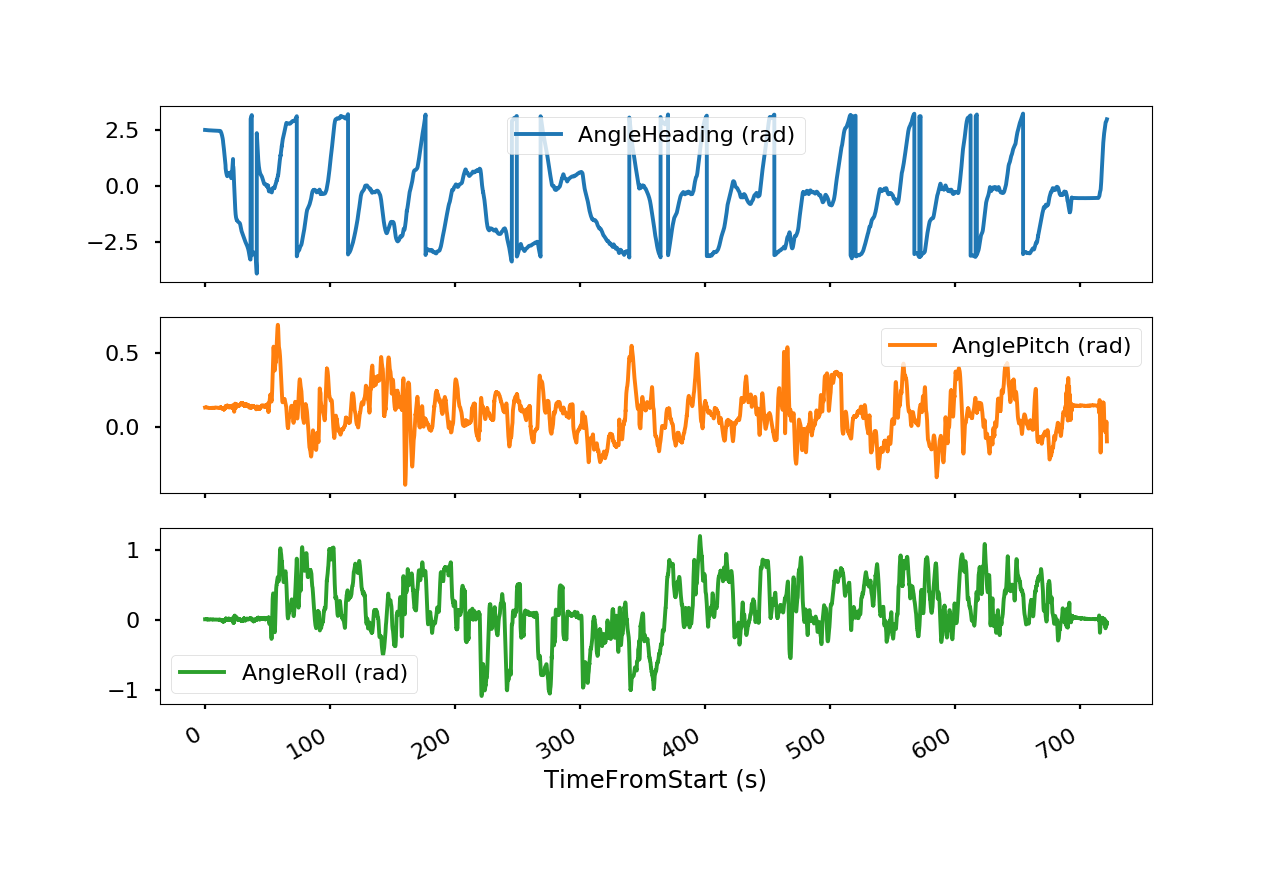
At this point the data is readily available for analysis, design, or simply visualization. For example, using the Matplotlib module we can quickly plot the Euler angles from this flight.
>>> from matplotlib import pyplot as plt
>>> df[['AngleHeading (rad)', 'AnglePitch (rad)', 'AngleRoll (rad)']].plot(subplots=True)
>>> plt.show()
Project Repository
The onavdata project repository is hosted here: https://gitlab.com/onav/onavdata
Read more about the motivation in this article: Reference Data Sets ↩︎
Comments